Summary: Latitude vs. X
Web Visualization Dashboard:
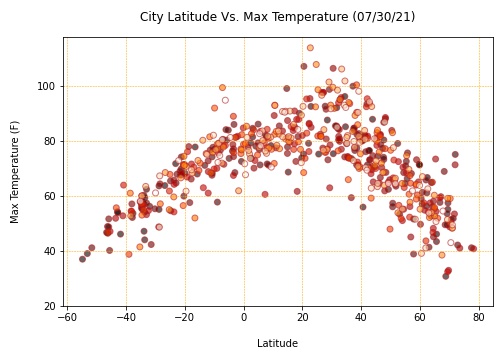
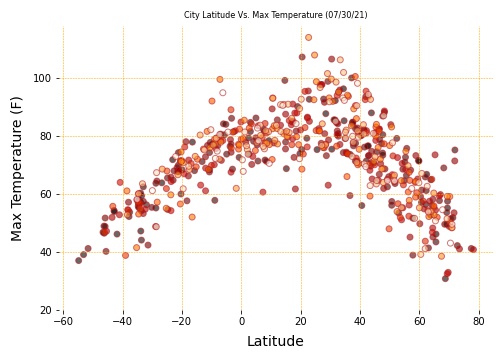
The purpose of this project was to analyze
the changes in weather against the distance from the equator.
To accomplish this analysis, python library citipy was
used to look up randomly generated unique geographical
coordinates (Latitude, Longitude) and retrieve the nearest city for each lat, lng combination.
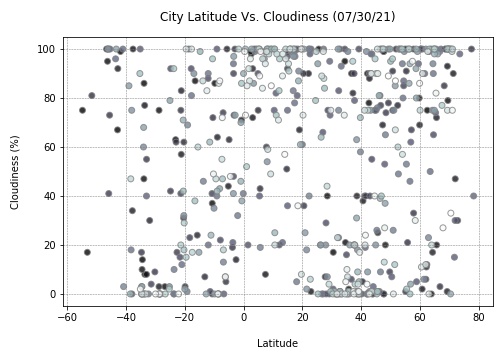
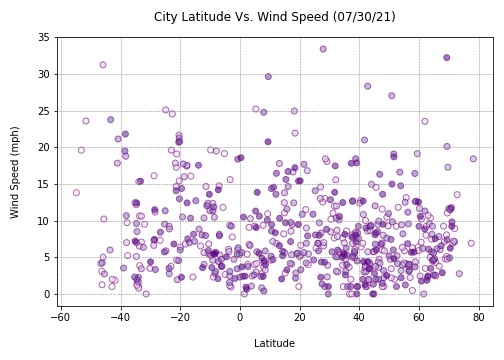
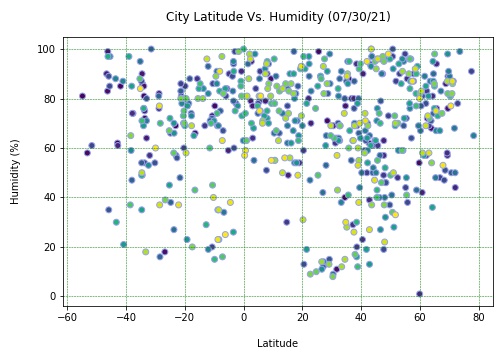
Weather data metrics - Max Temperature, Humidity, Cloudiness, and Wind Speed-were retrieved for each of the 590+ cities by using a series of successive API calls to OpenWeatherMap API to assemble a dataset.
After assembling the dataset, Matplotlib was used to plot these data metrics vs. latitude. The site provides the source data and visualizations created as part of this analysis, as well as explanations and descriptions of any trends and correlations witnessed.
Visualizations